Posts

Showing posts from 2012

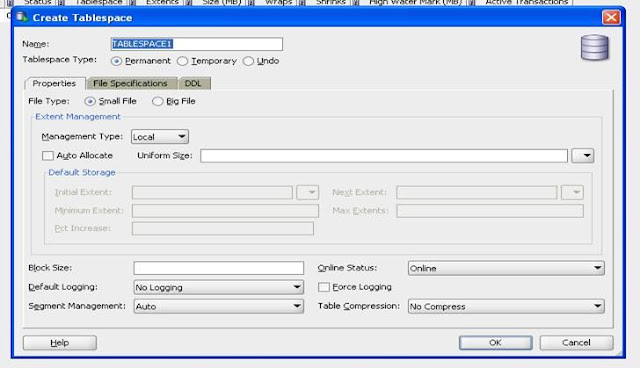
Using SQL Developer to create and view Tablespaces
Image
Below are the steps Create and View Table Spaces settings using SQL Developer. Required SQL developer version is version 3.0 To Create TableSpace : Click on Menu View/DBA - DBA navigator window will appear. In the DBA window add a new connection to the DB, and click connect. Then under storage option right click on Tablespaces and choose New Tablespace to create new one. Fill the Details as shown below: To View the created table spaces: Under Storage, Select Data Files: It will display the below:

Enabling GC Activity Logging Without Restarting the JVM

Enabling Garbage Collection (GC) activity logging normally requires a restart of the JVM hosting the service. Below steps explains how GC logging can be enabled without requiring a JVM restart for a chosen service. Assuming  user1  is the  owner  of the running JVM process, and  10274  is the  PID  (Process ID) of the JVM you are targeting, you can get the GC logging info from it by using: sudo -u user1 /usr/java/default/bin/jinfo -flag +PrintGC 10274 sudo -u user1 /usr/java/default/bin/jinfo -flag +PrintGCTimeStamps 10274 sudo -u user1 /usr/java/default/bin/jinfo -flag +PrintGCDetails 10274 Note: The output is stdout

Shell Script to add SSH automatic Login

Script to add SSH automatic Login #!/usr/bin/ksh -f RUSER=$1 RHOST=$2         if [ -z "${RHOST}" ]         then                 echo "\nUsage: $0 remoteUserName remoteHostName\n"                 exit 22         fi         if [ ! -f ${HOME}/.ssh/id_rsa.pub ]         then                 echo "SSH not configured for user ${LOGNAME} - creating key..."                 ssh-keygen -trsa -N "" -f ~/.ssh/id_rsa                 STATUS=$?                 if [[ ${STATUS} -ne 0 ]]                 then                         echo "SSH configuration FAILED for ${LOGNAME}"                         exit ${STATUS}                 fi                 chmod 755 ${HOME}         fi         echo "SSH configured for ${LOGNAME} OK." echo "Processing ${RUSER}..."         scp ~/.ssh/id_rsa.pub ${RUSER}@${RHOST}:id_rsa.pub.hotfix         STATUS=$?         if [[ ${STATUS} -ne 0 ]]         then            

Shell Script to kill all java processes on different hosts

Shell Script to kill all java processes on different hosts. The scripts assumes auto login using shh is enabled. The steps are explained here #!/bin/bash #################################### # Set These Values to correspond to your environment #################################### BLHOSTS=(linhtr1 linhtr2 linhtr3 linhtr4); SH_CMD=ssh #################################### SCRIPT_HOME=`dirname $0` for host in ${BLHOSTS[@]}; do      echo $SH_CMD $host "ps -ef | grep java|cut -b10-15|xargs kill -9"      $SH_CMD $host "ps -ef | grep java|cut -b10-15|xargs kill -9" done

Unable to create new native threads resolution

In one of our new machines, we are trying to start our servers. For 4 Servers, the system was working properly, but with 8 Servers it was throwing below exception. [gsc][3/20922] Caused by: java.lang.OutOfMemoryError: unable to create new native thread 2012-09-19 20:06:24,217 GSA WARNING [com.gigaspaces.grid.gsa] - [gsc][3/20922]: Reported Error [Restart Regex [.*java.lang.OutOfMemoryError.*] matching [Caused by: java.lang.OutOfMemoryError: unable to create new native thread]], restarting [gsc][1/] /<path>//bin/gs.sh: line 92: 21421 Aborted (core dumped) "$JAVACMD" ${JAVA_OPTIONS} -DagentId=${AGENT_ID} -DgsaServiceID=${GSA_SERVICE_ID} $bootclasspath $script_classpath ${RMI_OPTIONS} $libpath ${LOOKUP_GROUPS_PROP} ${LOOKUP_LOCATORS_PROP} -Dcom.gs.logging.debug=false ${GS_LOGGING_CONFIG_FILE_PROP} $NETWORK $DEBUG $launchTarget $command_line # # There is insufficient memory for the Java Runtime Environment to continue. # Cannot create GC thread. Out of system reso

ssh Auto Login without prompt for password

Problem:  On 4 of my Linux boxes i want to run some scripts by running them on all of boxes. I Login to one machine and run the script to use all 4 machines to perform the task. We use SSH to run our tasks. Therefore we need an automatic login from host machine to other machines. We don't want to enter any passwords, because you want to call ssh from a within a shell script. Steps to Perform this: We have 4 machines named linhtr01, linhtr02, linhtr03, linhtr04. We have same user and password on all 4 machines. Lets Assume Host machine as linhtr01. 1. Login to Host machine linhtr01. 2. Generate a pair of authentication keys without entering a passphrase   user1@linhtr01:~> ssh-keygen -t rsa Generating public/private rsa key pair. Enter file in which to save the key (/home/user1/.ssh/id_rsa): Created directory '/home/user1/.ssh'. Enter passphrase (empty for no passphrase): Enter same passphrase again: Your identification has been saved in /home/user1/.ss

To view more records in parameter file in VuGen

Image
We know that in Vugen parameter file, by default only 100 records are visible in the table as shown below. As we see below there are more records in the dat file, but only first 100 records are shown. To increase the number of visible records, perform the following steps: Go to config folder as C:\Program Files\HP\LoadRunner\config Open VuGen.ini Search for MaxVisibleLines By default it shows MaxVisibleLines=100 Change 100 to desired value like 10000 Save the file. Now reopen the parameter, 10000 rows will be visible.

Extended Log

Recently, I was running some support flows for a CRM application. After recording the scripts, I was about to run load test. For this purpose I refreshed the database. When I replayed the scripts with fresh database dump, close case started failing as shown below: Action.c(344): Notify: Transaction "11. Close Case" started. Action.c(346): Error -26368: "Text=com.uif.common.ExceptionInfo" found for web_global_verification ("CRMGlobal") (count=1)         [MsgId: MERR-26368] Action.c(346): web_custom_request("crm_39") highest severity level was "ERROR", 3811 body bytes, 312 header bytes     [MsgId: MMSG-26388] Action.c(346): Notify: Transaction "11. Close Case" ended with "Fail" status (Duration: 1.1719). As we can see above there is an exception com.uif.common.ExceptionInfo. The above detail was displayed when the logging level is set to standard log. Since an exception has occurred after refreshing

THINK TIME – Part 1

Image
According to VuGen Document think time is "The time that a user waits between performing successive actions is known as the think time."   Think time is the time spent by a user perusing a Web page, including viewing the page and determining the next action. Think time does not include the time that is required for a page to load.   Why think time is important? Answer will be Think time makes our scripts more realistic. But why does think time matter? If I have a simple script that logs into an application, performs some actions like check account balance, Transfer amount ..etc and then logs out, why do I care if it pauses in-between page requests? Actually, Think time matters because it holds the current user's session for a realistic period of time. This means the memory footprint of that user exists for longer (compared to not using or ignoring think time) and as a consequence we can be more confident that our scripts/test is providing a useful representation

What is HTTP?

What is HTTP? HTTP is the protocol that web clients (like a browser) and a server use to talk to one another. Knowledge of HTTP is essential for understanding how web performance test scripts or in general web work. When we are looking at performance logs, knowledge of HTTP understanding will help us to verify that a HTTP request was successful and that there were no errors generated during a test run. 3 Main Elements a HTTP message is made up of: All HTTP messages are generally made up of three main parts: Request – a client makes a request using either a GET or a POST method ·          GET method – is a request for info located at a specified location on the server. “GET” is basically for just getting (retrieving) data. ·          POST method – allows data to be sent to the server within a client’s request (an html form would be one example). “POST” may involve anything, like storing or updating data, or ordering a product, or sending E-mail. Headers - zero or mo

Multithreading

Image
Multithreading: In Loadrunner we have two options under Multithreading in Runtime settings. 1.       Run Vuser as process 2.       Run Vuser as thread If Run Vuser as thread is selected, Multithreading is enabled. Benefits of Multithreading – Helps to run more number of vusers per load generator. The contoller uses a driver program ie mdrv.exe or r3vuser.exe to run vusers. If we run vuser as thread, the contoller launches only one driver program for every 50 users. 50 Vuser is default setting. If we run each vuser as a process, Multithreading is disabled and it launches drivers program in to memory again and again for every instance of vuser. This uses large amount of RAM and other system resources. How to find which protocol is threadsafe? Except for Sybase-Ctlib, Sybase-Dblib, Informix, Tuxedo and Peoplesoft-Tuxedo protocols, all other protocols are threadsafe . Using VuGen: Launch VuGen. Select File->New. Select a protocol and cancel recording.

Shell Script to remove files recursively from a folder

Shell Script to remove files recursively from a folder with 10 minutes each: When we were running a Load test or stability test, one of the transaction creates files in a directory. These files need to be deleted when ran for long runs. In Linux: fdir="<path>/App_domain/attachments/lit/*" while [ true ] do find $fdir -cmin +10 -type f -exec rm -rf {} \; sleep 500 done when tried the above on solaris, it failed as -cmin is not supported in Solaris. Only options supported are -atime, -ctime and -mtime. but these works on hours and not on minutes. Modified the script to run in solaris: fdir="<path>/App_domain/attachments/lit/*" while [ true ] do touch somefile sleep 5 find $fdir ! -newer somefile -exec rm -rf {} \; sleep 500 done

Using gdb to analyse core dumps in Linux

Once core file is generated. Steps to analyze the core dump file- Run “gdb /usr/java/jdk1.6.0_24/bin/java (java path) core.11151 (core file)” You will get the gdb prompt Type “bt” for stack trace. To switch the thread, type “thread [thread no]” To check the stack trace for selected thread again type “bt” To get the stack of all the thread run “thread apply all bt full” Find “LowMemoryDetector::low_memory_detector_thread_entry” in stack trace. To find exactly in which thread it occured, type "where" Example of "where" output: where #0  0xffffe410 in __kernel_vsyscall () #1  0x00b0ddf0 in raise () from /lib/libc.so.6 #2  0x00b0f701 in abort () from /lib/libc.so.6 #3  0xf78e123f in os::abort(bool) () from /usr/java/jdk1.6.0_24/jre/lib/i386/server/libjvm.so #4  0xf7a28431 in VMError::report_and_die() () from /usr/java/jdk1.6.0_24/jre/lib/i386/server/libjvm.so #5  0xf7a28fe1 in crash_handler(int, siginfo*, void*) () from /usr/java/jdk1.6.0_24/jre/lib/i386/se

PSR Tool in Windows 7

Image
PSR Tool in Windows 7 Many people are not aware about an amazing tool included in Windows 7 .  The tool is called Problems Steps Recorder.  Before you start a flow, start the PSR and it will take screen shots every time the mouse clicks on the screen and will keep a log of what happened when the mouse button clicked.  After you are done running the flow, stop the PSR and save the file.  If you have a defect, you can send this to dev team and then they will not bug you to reproduce.  This will save precious time!! Also this tool can give good solution for KT sessions, defects, user guides or any other area that requires step by step description and screenshots (and you don’t need to do anything, just to run the flow or perform the activity) 1.        In Windows 7 , click start menu and type “psr” 2.        When psr.exe shown up on menu, click on it to open 3.        This will open: 4.        Click on the arrow at the very right side and click settings. 5
Little's Law : If we consider customers C arriving at a rate R to the server and spending T time utilizing the server, we can say that C=R*T. This is known as Little’s Law. For a given system the throughput of a system can be measured by dividing the number of users with the time spent in the box (R=C/T). Now let’s assume that users will wait a To time in between requests, which we know as a think time. This is an interval typical for users to interact with the system. So from the C=R*T we can expand and infer that the number of users in think time will be Co=R*To. But the number total of users in such a case will be CTotal = C+Co = R*T + R*To = R(T+To). So CTotal = R(T+To). R=C/(T+To) where T is time spent in the Server(response time), To is the average think time,   C number of users and R the throughput.       If we had a system with 200 users requesting services with 1600 request for 15 minutes and response time average of 2 seconds we can characterize
Little's Law - To Get Concurrent Number of Users   One of the basic queuing theory principles applied in Software Performance Engineering is Little's law (a). It states that the total number of users in the system is equal to the product of throughput and response time. Total Number of Users = Throughput X Response Time While calibrating your load test runs, one should always cross check the test results (throughput, response time, user-load simulated) to identify whether the load generator nodes themselves are not becoming the bottleneck in the system. From performance test results we can easily calculate the concurrency for a particular transaction using Little’s Law. Little’s law allows us to relate the mean number of items in the system in our case concurrent users with the mean time in the system (response time) as follows: Number of Items in the system = Arrival Rate x Response Time Rule to remember before you use little law you must make

What is the difference between a process and a thread?

Process is defined as the virtual address space and the control information necessary for the execution of a program while Threads are a way for a program to split itself into two or more simultaneously running tasks. In general, a thread is contained inside a process and different threads in the same process share some resources while different processes do not. In terms of Loadrunner: Running as Process: - When we run Vuser as a process, LoadRunner creates 1 process called mmdrv.exe per Vuser. So if we have 10 Vusers, we will have 10 mmdrv.exe processes on our machines. - If you run each Vuser as a process, then the same driver program ( such as mdrv.exe or r3vuser.exe) is launched (and loaded) into the memory again and again for every instance of the Vuser. - Loading the same driver program into memory uses up large amounts of RAM (random access memory) and other system resources. This limits the numbers of Vusers that can be run on any load generator. -Disables MultiThreadi