Posts

Showing posts from August, 2014

Tool : PerfAnalyzer

Image
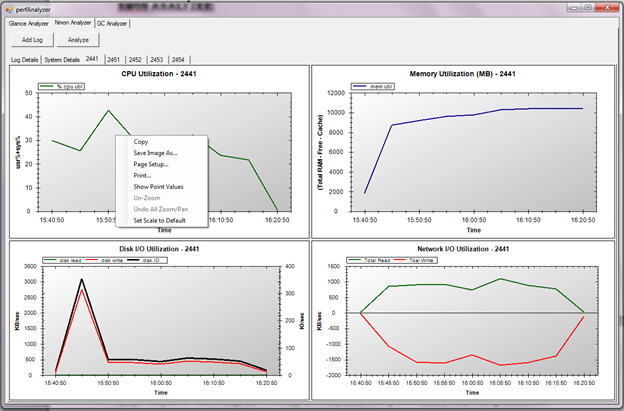
Tool : PerfAnalyzer This tool developed internally for analyzing the output of Glance, nmon and GC Logs. The tool has three tabs: 1.        Glance Analyzer 2.        Nmon Analyzer 3.        GC Analyzer Glance Analyzer: This is used to analyze the output of Glance command. It is sub-divided into two tabs: 1.        Off-line Mode :  To analyze the saved Glance output 2.        Online Mode : To analyze the Glance Logs online while the test is running. (Enhancements in Progress) Inputs required: Glance output file. Output obtained : Graph outputs of CPU Utilization, Memory Utilization, Disk Utilization and Swap Utilization. Also gives Min, Max and Avg values for CPU, Memory and Disk Usage. Nmon Analyzer: This is used to analyze the output of nmon command. Inputs required: nmon output file. Output obtained : Graph outputs of CPU Utilization, Memory Utilization, Disk Utilization and Network Utilization. System summary gives CPU Info

Finding memory problems

Finding memory problems: When performance testing a java application and want to identify memory problems, below steps will help: 1.    Don’t call it “memory leak” until you are 100% sure-make your program manager jump up and down. (A better term “unaccountable heap usage”, etc.) 2.    There is probably some “unaccountable heap size” from each release, there is no need and no time to look for small ones. Concentrate on the large ones which could cause problem down the road. 3.    There are some caches which is not leakage-watch out for their growth in size. Also check for some session data, which might be cleaned up after user logoff. 4.    Run 72-90 hour stability test under load for each release, monitoring java heap size. Check java heap GC frequency and old gen size. (cat “Full GC” myServer.log |awk ‘/Full GC/ {getnextline; getnextline;getnextline;print $0}’ | awk ‘{print $4}’) 5.    Enable GC Logging in JAVA_OPTIONS by adding appropriate flags: "