Tool : PerfAnalyzer
Tool : PerfAnalyzer
This tool developed internally for analyzing the output of
Glance, nmon and GC Logs.
The tool has three tabs:
1.
Glance Analyzer
2.
Nmon Analyzer
3.
GC Analyzer
Glance Analyzer:
This is used to analyze the output of Glance command.
It is sub-divided into two tabs:
1.
Off-line Mode :
To analyze the saved Glance output
2.
Online Mode :
To analyze the Glance Logs online while the
test is running. (Enhancements in Progress)
Inputs required:
Glance output file.
Output obtained :
Graph outputs of CPU Utilization, Memory Utilization, Disk
Utilization and Swap Utilization.
Also gives Min, Max and Avg values for CPU, Memory and Disk
Usage.
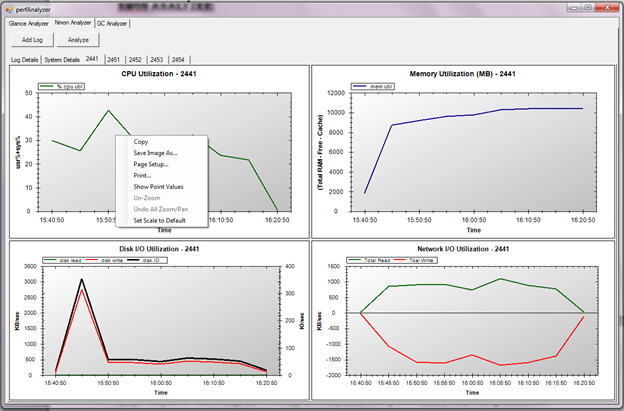
Nmon Analyzer:
This is used to analyze the output of nmon command.
Inputs required:
nmon output file.
Output obtained :
Graph outputs of CPU Utilization, Memory Utilization, Disk
Utilization and Network Utilization.
System summary gives CPU Info, Memory Info and Partition
Info.
GC Analyzer:
This is used to analyze the output of GC Logs of Sun java.
Inputs required:
GC output file.
Output obtained :
Graph outputs of Used Heap, GC Time, Full GC lines, Used
Young Generation, Total Young Generation and Total Heap.
Outputs:
1.
All the Graphs can be copied directly to
clipboard or Save Image.
2.
Zoom out/In functionality is available.
3.
Show Point Values functionality is also
available.
4.
Change the Scale and Reset back to original
scale.
Click on the below Link to access the zip file for the setup.
https://sites.google.com/site/nonfunctionaltestingtools/perf-analyzer
Once the zip file is downloaded. Run the Setup.exe to start the tool.
Post any comments/Suggestions for further enhancements or doubts.

Hi Lakshmi, how can we run this tool ?
ReplyDelete